![]()
Statistics
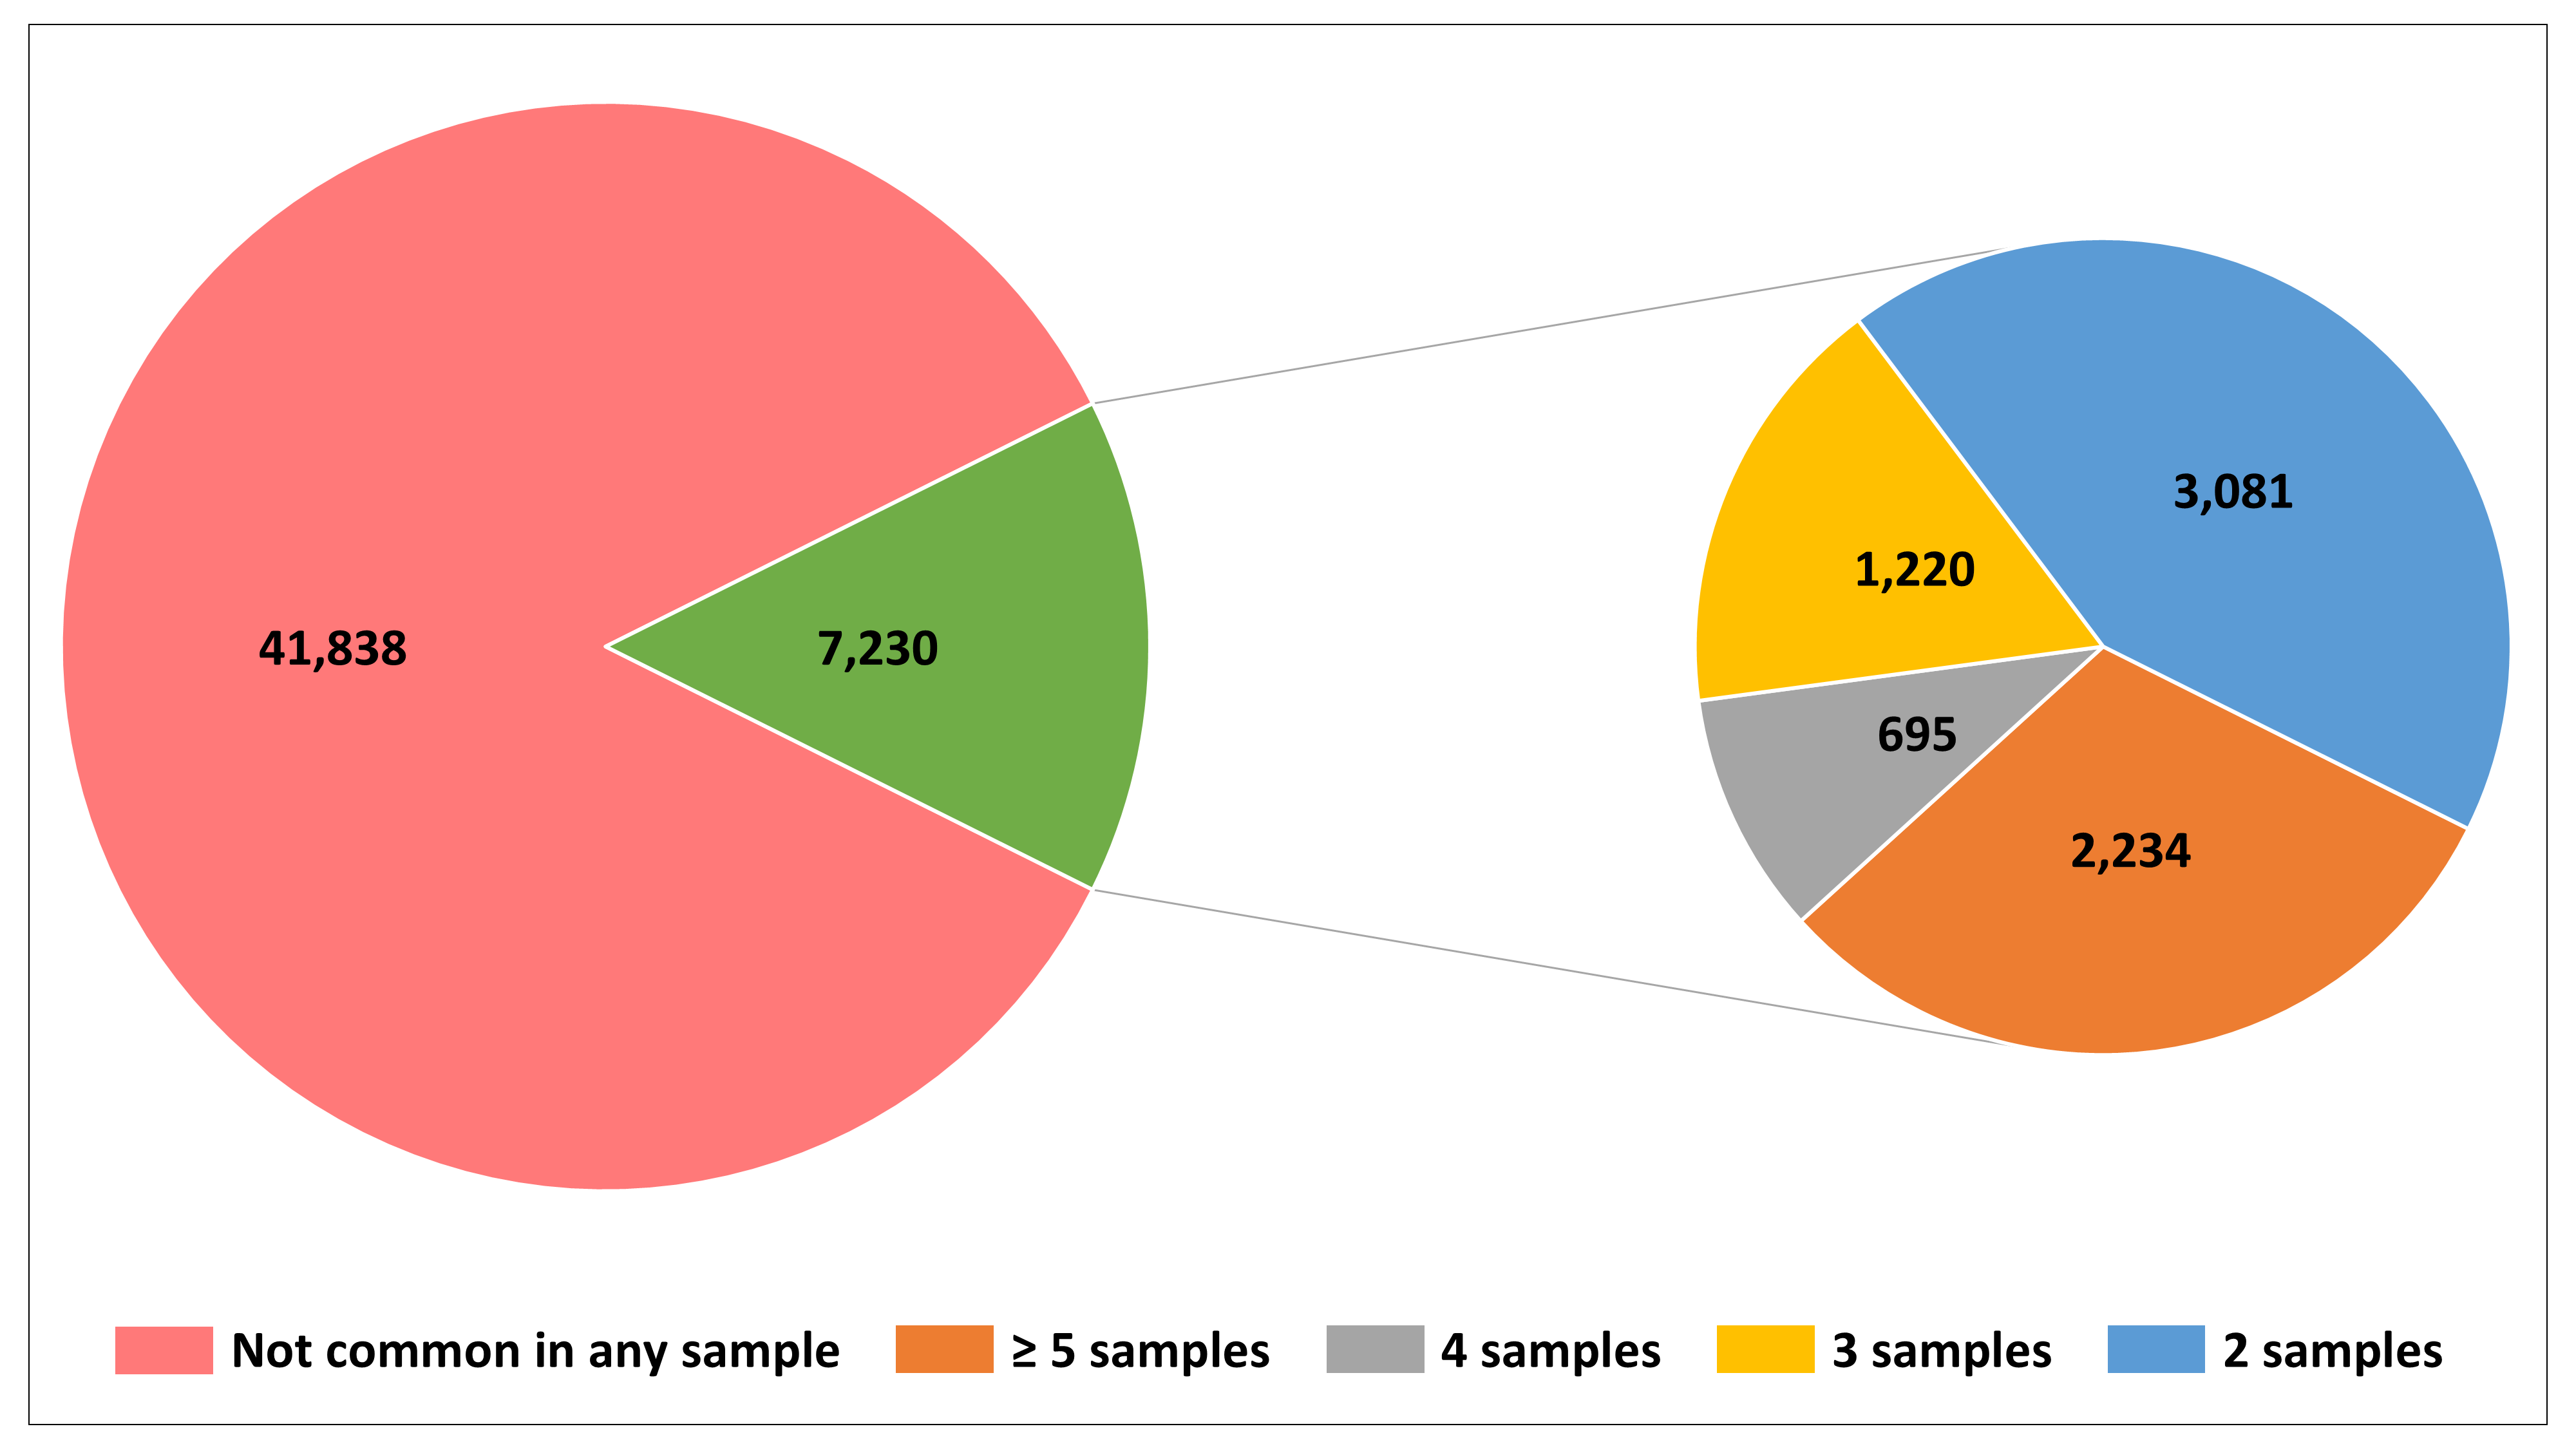
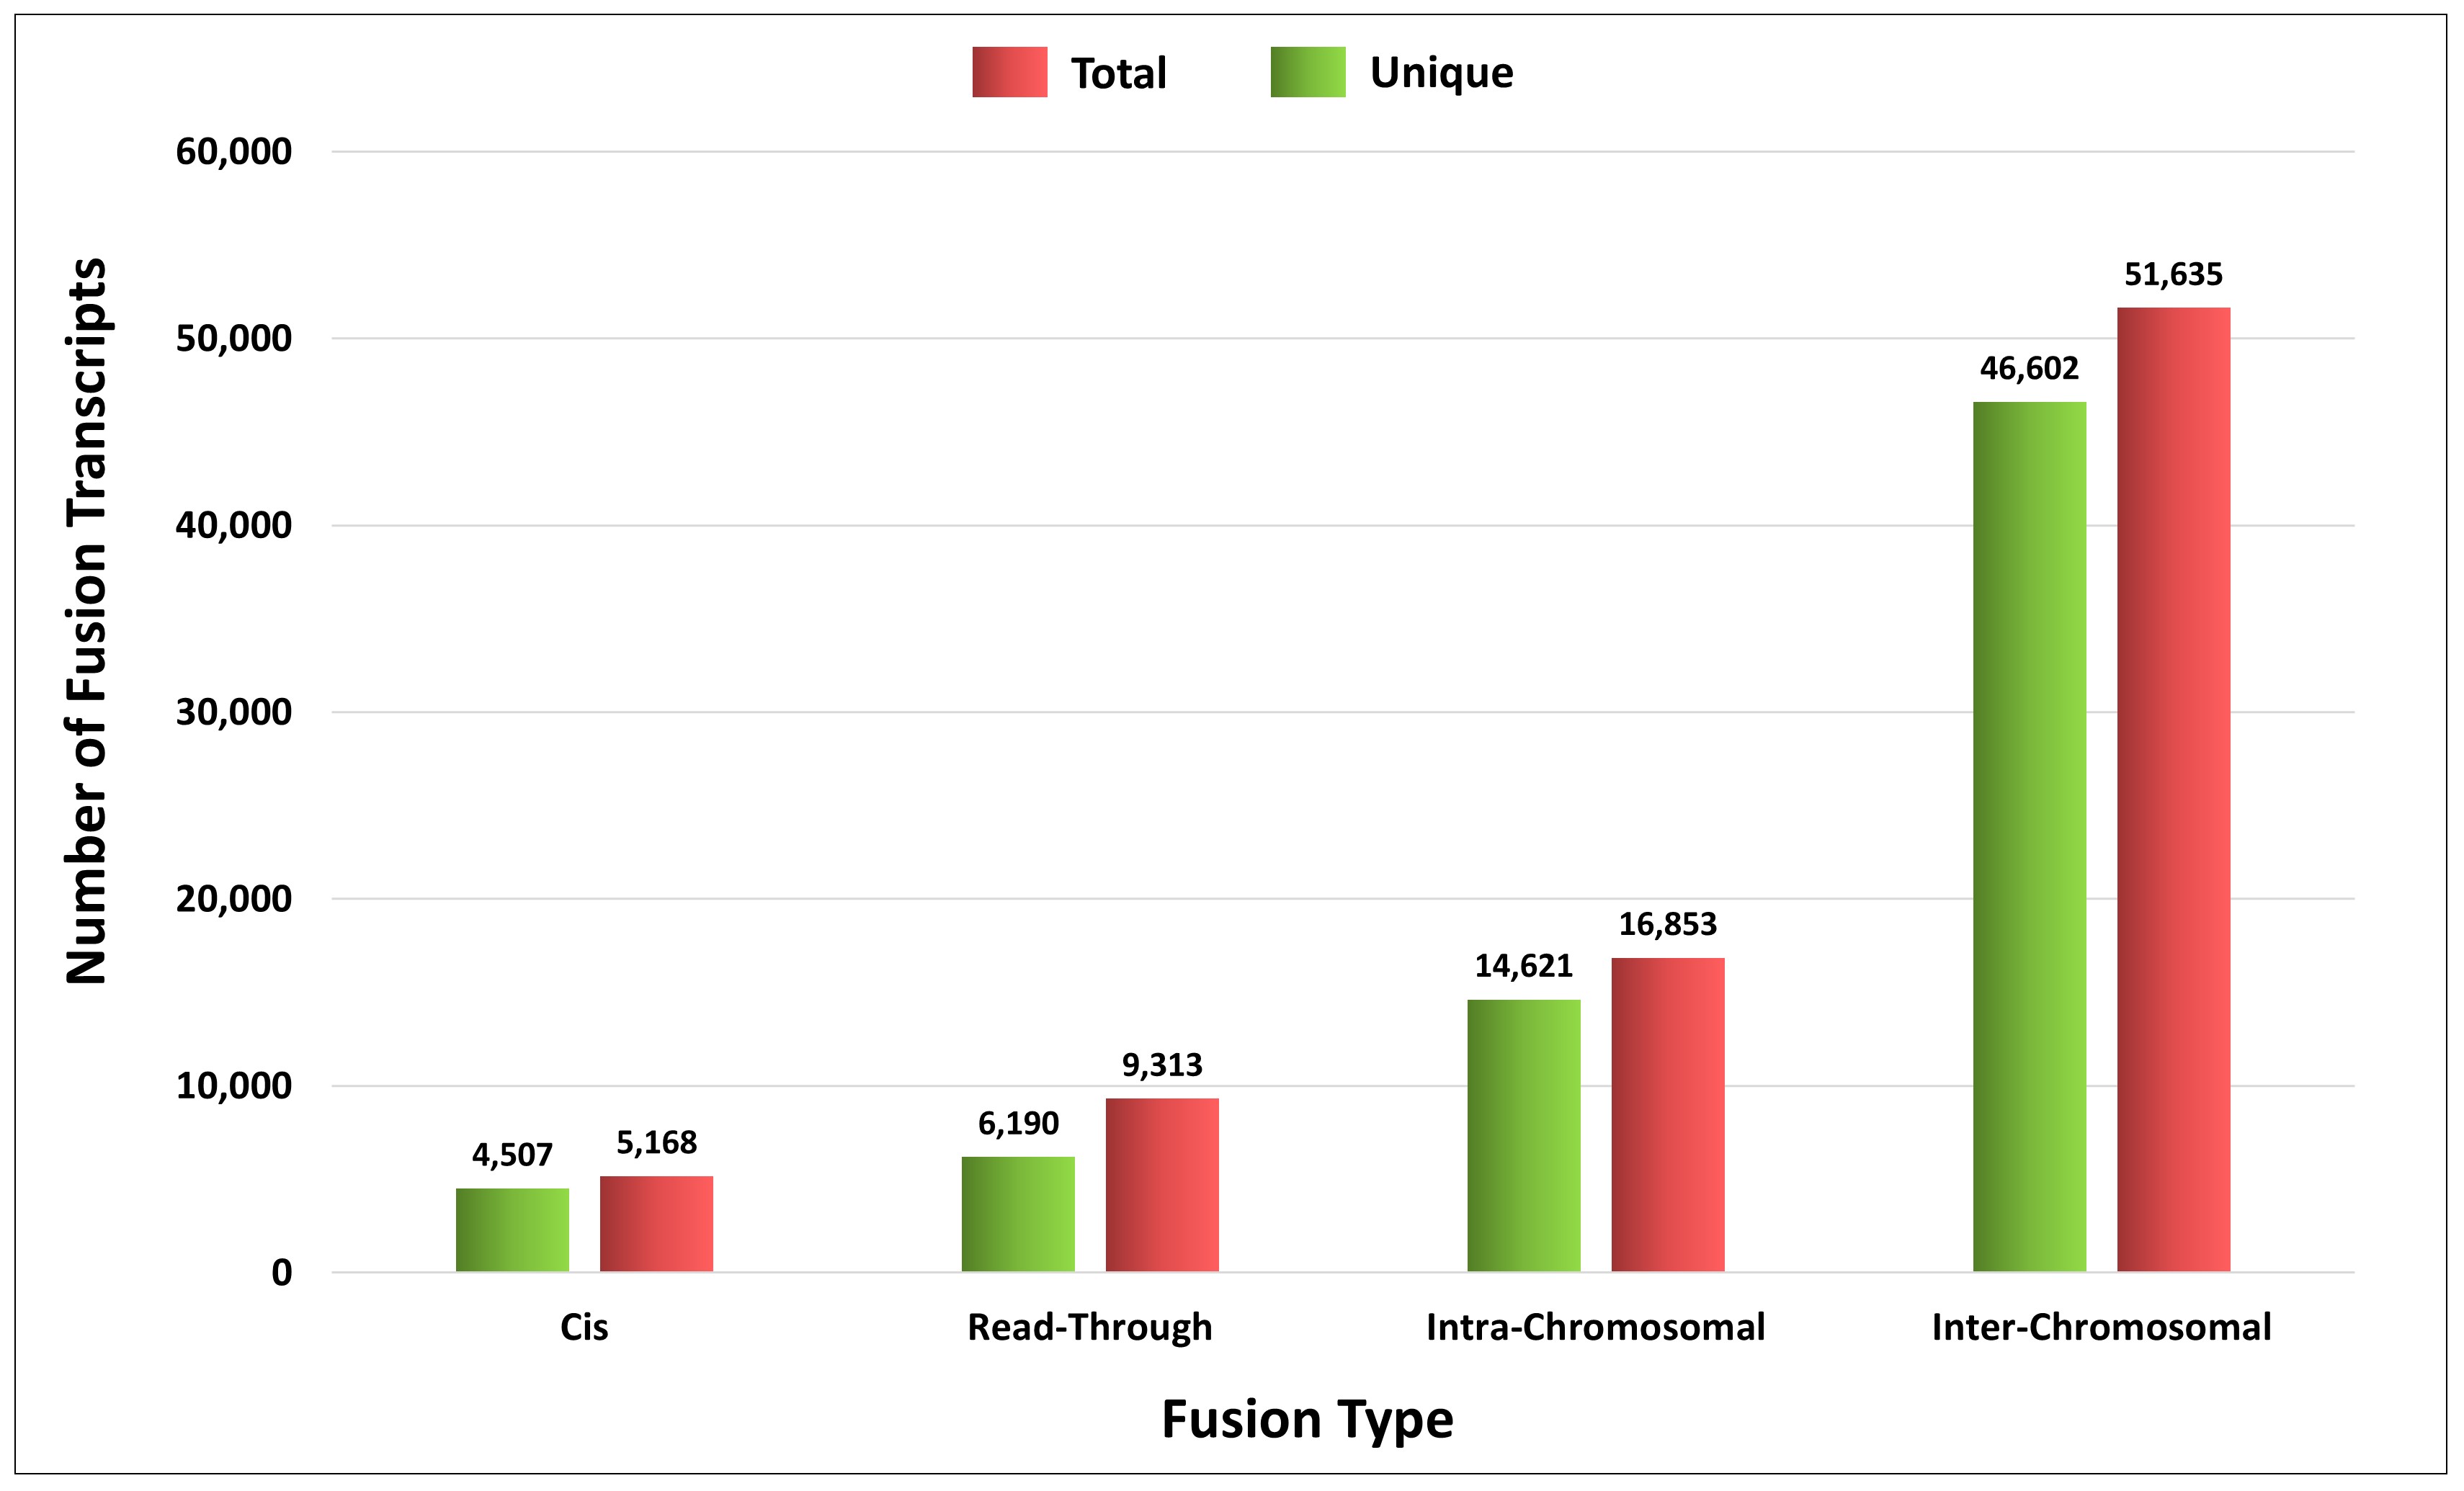
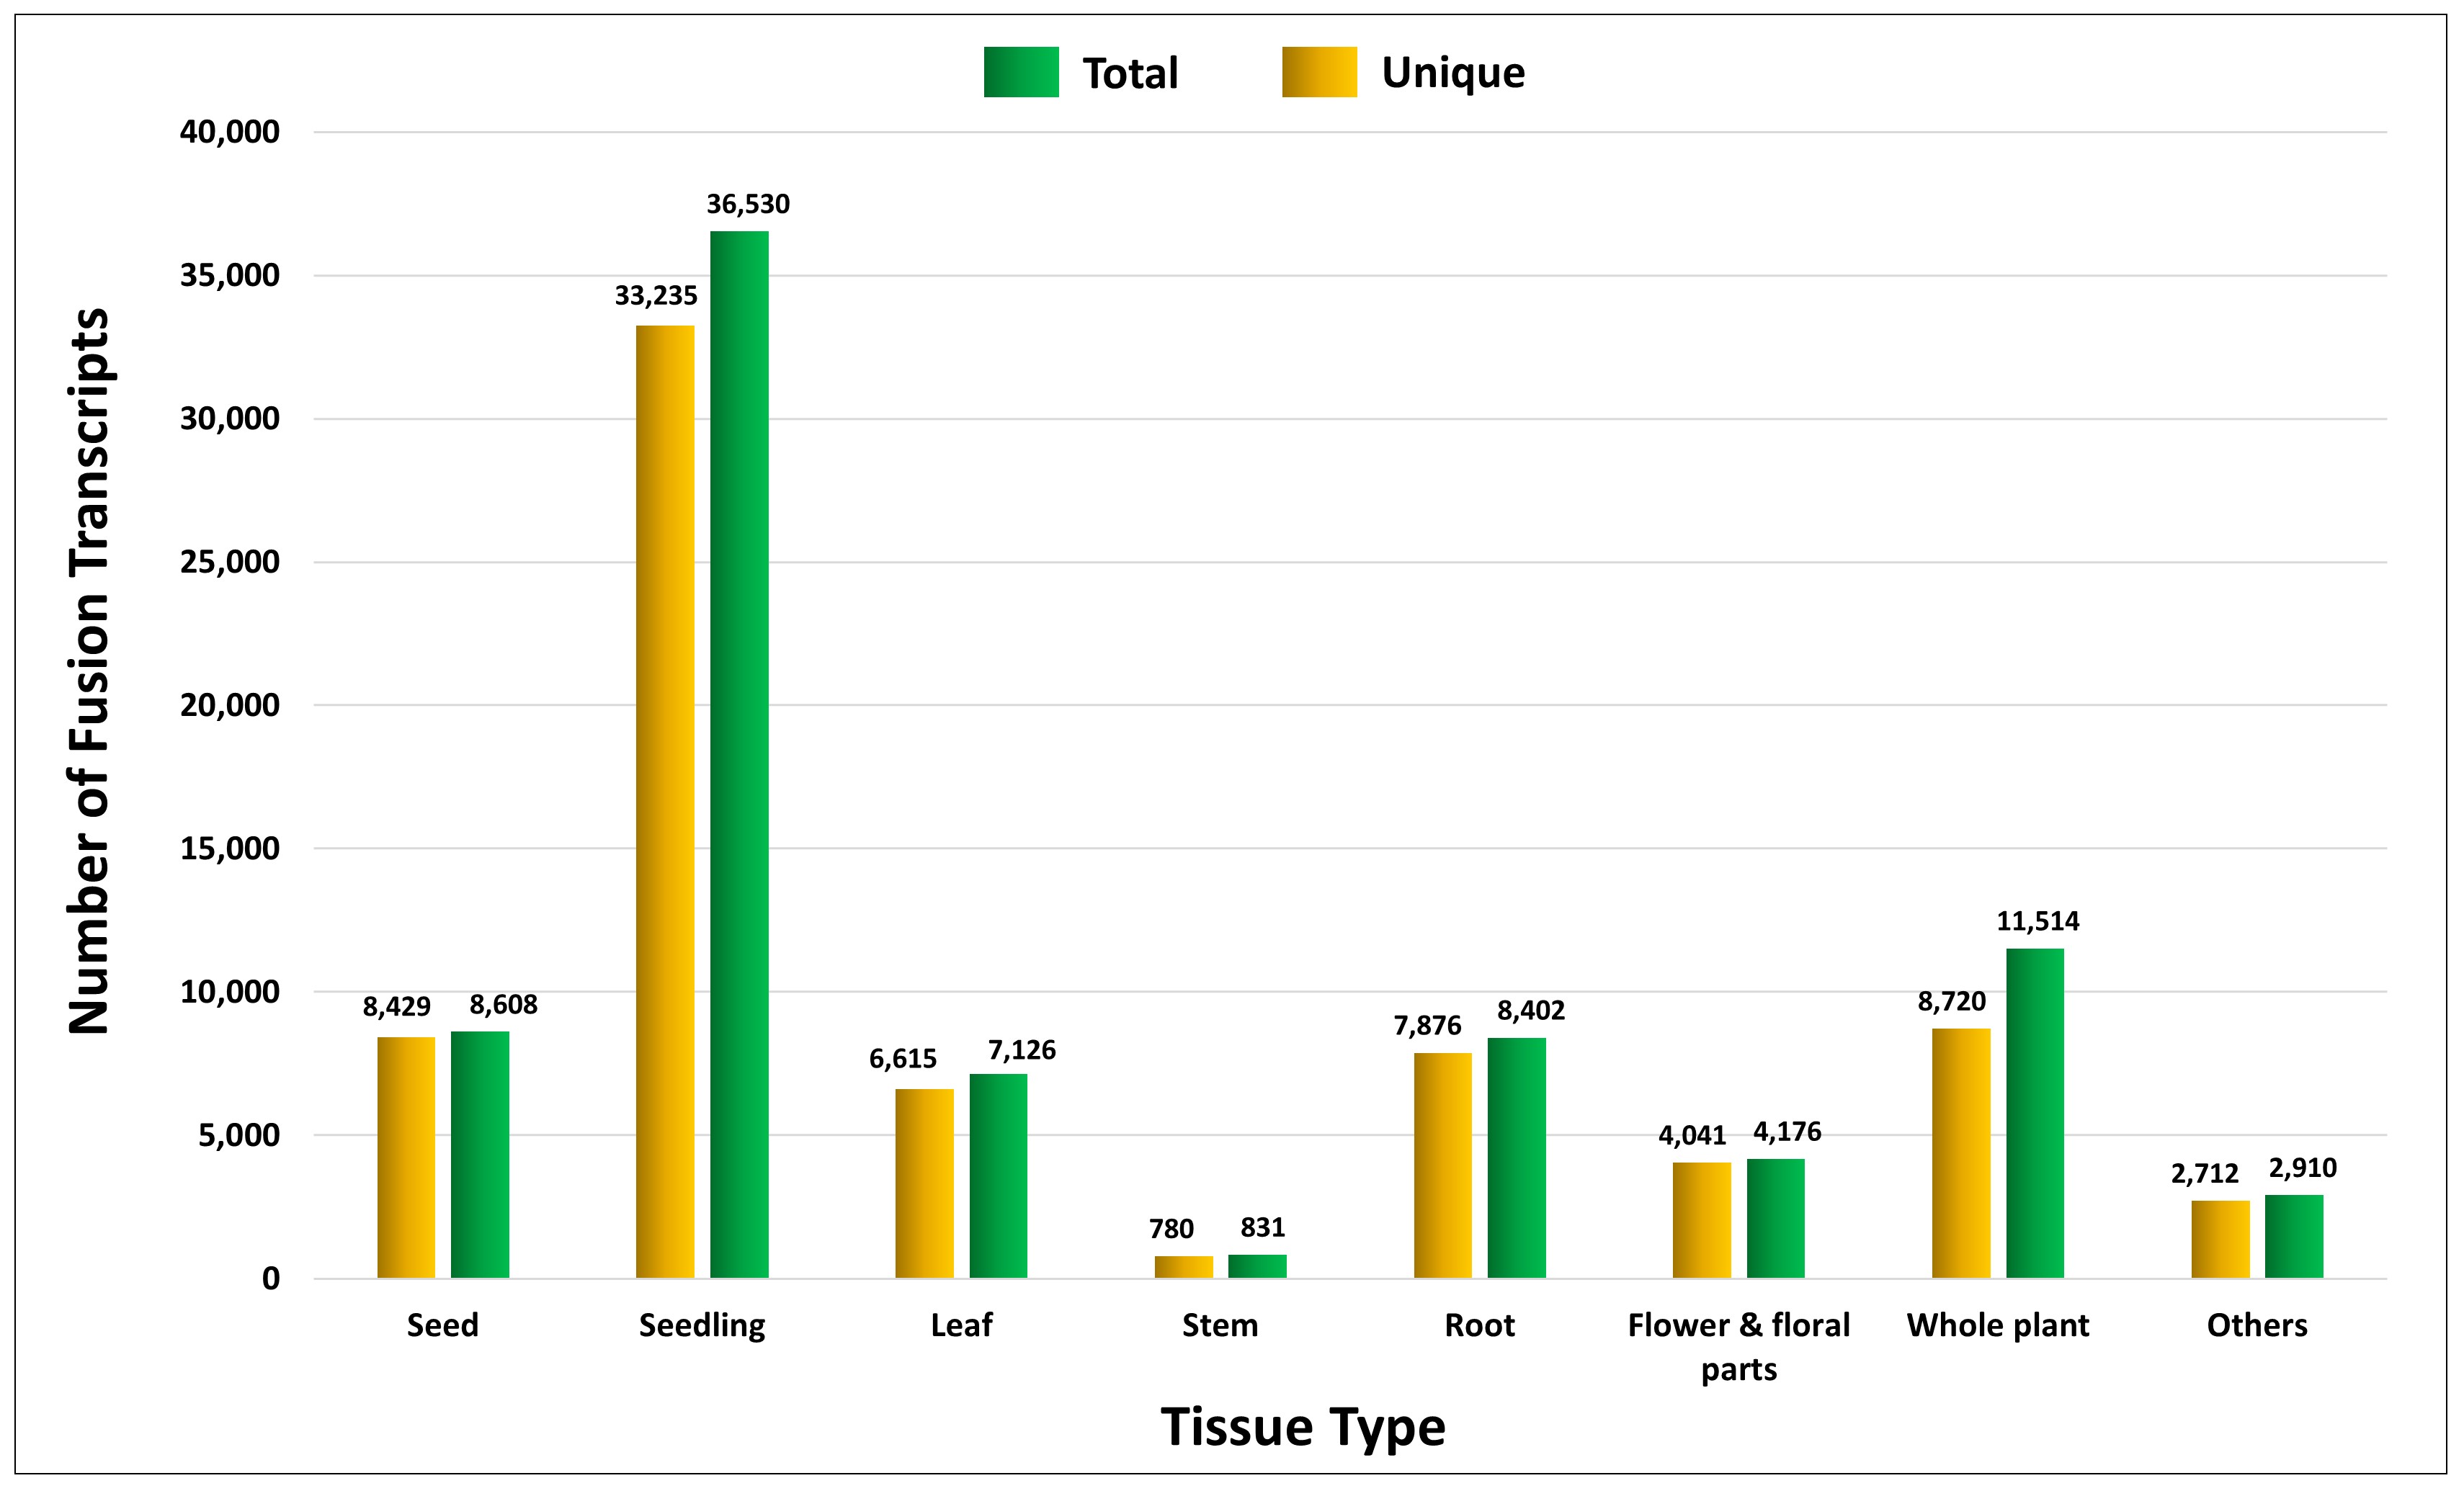
This page shows the important statistical information related to the fusion transcripts of AtFusionDB database. User can find bar plots showing Fusion type and Tissue type wise classification of fusion transcripts. A pie chart is used to represent the sample wise distribution of fusion transcripts into 5 categories according the the number of times a fusion transcript is occuring in different samples.
 Fusion transcript classification
| Total paired end RNA-seq samples of Arabidopsis thaliana | 4,697 |
| Total samples from which fusions are detected | 3,661 |
| Total samples with fusion transcripts having > 0.5 EricScore | 3,520 |
| Total fusion transcripts with > 0.5 EricScore | 82,969 |
Total number of enteries categorized on the basis of EricScore
| EricScore range | Number of entries |
| 0.9 - 0.99 | 16,576 |
| 0.8 - 0.9 | 13,264 |
| 0.7 - 0.8 | 13,514 |
| 0.6 - 0.7 | 16,639 |
| 0.5 - 0.6 | 22,976 |
| Total entries | 82,969 |
Fusion type wise classification
 Tissue-wise distribution of fusion transcripts
 Sample wise distribution of fusion transcripts